Category Archives: Uncategorized

Real Issues in Real Estate

Below you’ll find my take on timely topics and issues of concern to anyone involved in real estate, either as a consumer or professional.  Scroll down to see my latest postings.  You can also review past articles by clicking the “Review Recent Posts From This Blog”  or by searching the category links on the right side of the page.

For future visits you can access this site using the new .REALTOR extension on my URL: http://wwwJamesStefanile.REALTOR

As always, your comments and questions are important to me.  Please tell your friends and colleagues about this blog.  I encourage you and them to subscribe.

Jim Stefanile

James Stefanile Web

james.stefanile@BHHSNJ.com

1 Comment

Filed under Uncategorized

Useful Information

BHHSNJ NJ301_H_Seal_cab_cmyk

by James Stefanile, ABR, GRI, SRES, QSC, gCertified, REALTOR/Salesperson, Berkshire Hathaway Home Services New Jersey Properties, Montclair Office

Here are some useful links to issues of special interest to home buyers:

Lead Paint:

https://docs.wixstatic.com/ugd/2d14f4_a4023be137b94271aa4cd99ee0f257af.pdf

Mold:

https://www.epa.gov/sites/production/files/2016-10/documents/moldguide12.pdf

Asbestos:

https://www.epa.gov/asbestos

Underground Oil Tanks:

https://www.epa.gov/ust

Termites:

https://www.epa.gov/safepestcontrol/termites-how-identify-and-control-them

Radon:

https://www.epa.gov/sites/production/files/2016-12/documents/2016_a_citizens_guide_to_radon.pdf

Fire Extinguishers:

https://www.osha.gov/SLTC/etools/evacuation/portable_about.html

Flood Maps:

https://msc.fema.gov/portal/home

Fair Housing:

https://www.hud.gov/program_offices/fair_housing_equal_opp

Fair Lending:

https://www.hud.gov/topics/fair_lending

EPA.gov:

https://www.epa.gov/

HUD.gov

https://www.hud.gov/resources

Residential Housing Styles:

https://magazine.realtor/home-and-design/guide-residential-styles

If any questions you have are not addressed via these links please get in touch with me.

Happy House Hunting!


Leave a comment

Filed under Uncategorized

Stats! Stats! Stats! Local End of Year 2018

BHHSNJ NJ301_H_Seal_cab_cmyk

by James Stefanile, ABR, GRI, SRES, QSC, gCertified, REALTOR/Salesperson, Berkshire Hathaway Home Services New Jersey Properties, Montclair Office


Last month I highlighted the stats and projections from the Otteau Valuation Group seminar I attended.

Those were both state-wide and local and a look forward.  This time, let’s look back and deeper into the local Essex County stats for the last 5 years, starting with the days on market and percentage of what sellers received vs. what they asked:

0001

I’ve highlighted Montclair to show the flow of the charts but it’s not the only township which has shown growth over the years.  Notice that the lowest sellers are getting is 95% of what they asked and that’s in only 1 town.  Growth over the 5 years is also strong in this category for most towns or consistent at a high levels for some towns.  Montclair and Glen Ridge stand out where sellers are getting 108% and 106% of what they ask respectively.  6% or 8% may not seem like much until you consider we’re talking about 6% or 8% of hundreds of thousands of dollars.

You’ll also notice a steady decrease in the days on market across the board.

0001-1.jpg

The table above shows an increase in number of closings overall, sometimes dramatically do over the 5 year span.  As for prices, while the 5 year price appreciations have been in double digits overall, a couple of towns have slipped or appreciated slowly in the 5 year look-back.  Even more interesting is the 2017-2018 comparison where more than a few towns have lost ground or only advanced slightly.  Even stellar Glen Ridge has slipped slightly.  Poor Cedar Grove got clobbered in 2018 vs. 2017 and surprising Caldwell has become the league leader with an 18% appreciation year over year.

There are, as always, various factors and variables that account for ups and downs. Some may be anomalous (more sales in one price range or another, for example).  Most of the year over year figures coincide with the general stabilizing trend in the NJ housing market.  The balance advantage between seller and buyers is equalizing so price reductions and lower initial asking prices can contribute the overall trends.

0001-2.jpgFinally, this table shows the total number of listings taken per year and the absorption rate per town.  The absorption rate is the time it would take to sell what’s on the market expressed in months.  Most towns have a lower absorption rate vs. 2014 (some only a little bit lower),  but a couple have rates that have risen substantially.  These are towns with a greater proportion of luxury properties.  That segment has been losing steam for about a year.  Overall, the rate has fallen almost by half.

It’s hard not to miss the fall off in number of listings taken over the 5 year period.  The further you get from the recession, the smaller the amount of listings taken as inventory falls to the low point we have today.  It’s striking that 7 towns have listing numbers in 2018 that were lower than 2017.  Don’t be fooled by positive percentages of listings taken year over year ’17 to ’18 like the 33% increase in Glen Ridge.  That represents just 6 more listings.  The impressive 22% increase in Bloomfield only represents and additional 27 homes for sale. Overall the number of listings taken has decreased, a sign of the lack of inventory today.

As usual, in Essex County there are stand-out towns where the news is always good and a bunch of other places where the market may be flat or, even, declining.  If “all politics is local” is a truism, “All NJ towns are different local markets” is the housing market truth.

1 Comment

Filed under Uncategorized

End of Year 2018 Housing Forecast

BHHSNJ NJ301_H_Seal_cab_cmyk

by James Stefanile, ABR, GRI, SRES, QSC, gCertified, REALTOR/Salesperson, Berkshire Hathaway Home Services New Jersey Properties, Montclair Office

Recently I attended the Fall Housing Workshop hosted by Jeffrey Otteau of the Otteau Group, Inc.  Mr. Otteau is generally recognized as one of the foremost authorities on New Jersey real estate.  His seminars are always packed with facts which support his conclusions.  Looking back on his prior predictions, he is invariably correct.

JefferyOtteau

Jeffrey Otteau

Mr. Otteau mingled some macro-economics with this housing market status report and predictions.  The recent economic trends are pertinent to the shifting housing market.

To start, the overall US economy is doing well with GDP growth above 4% and higher than predicted.  Unemployment is at the lowest level since 1969.  2018 was the 8th consecutive year the economy gained more than 2 million jobs.

Significant, according to Mr. Otteau, is that the economy experienced an upward spike in early 2018 as a result of deregulation and tax cuts on businesses.  This, as we will see shortly, has a direct bearing on the housing market.

These economic benefits are now allowing New Jersey to catch up.  We’re doing better since the nation is doing better even though the state has been slow to the party.  2018 was the best year for job growth and creation since the recession ended with household income also rising by 4% as opposed to 1% in previous years.  As a result New Jersey’s household income is now the 3rd highest in the nation.  Our job engine has been currently driven by healthcare which has replaced tech as New Jersey’s strongest commercial sector.  New Jersey unemployment is at 4.2% as opposed to 3.7% nationally.

The following slides are used with permission.

0012

This map shows income and unemployment by county and you can see the northeastern part of the state is in the best shape with the exception of the unemployment gash running from Passaic county down through urban Essex and Union Counties.  You’ll also notice that Essex and Union Counties are noted as distinct suburban and urban counties with different income and unemployment stats.

Through the 3rd quarter of 2018 the nation matched the number of transactions and their dollar value with 2005 which was the last year of the housing boom.  It’s important to note that these healthy numbers were achieved without the help of sub-prime mortgage lending which was the leading cause of the boom years until 2006.

I’m sure everyone has heard the housing market is changing.  The numbers, as you’ll see shortly support this.  Mr. Otteau describes this as a housing market in transition with the advantage between buyers and sellers beginning to balance out.  Sellers are no longer in control.  Buyers may not have to “drive til you qualify” out of the eastern part of the state in order to find affordable housing and pragmatic sellers.  Also, a declining market is not seasonal but, rather, a combination of rising home prices and higher interest rates which outpace income increases.  This gap may give some buyers pause and will kick some buyers out of the market altogether.  It is but one factor in the changing market.  As homes linger longer for sale, prices may level off .  The primary markets (towns) in New Jersey will be affected less (or not at all) and may continue to be competitive.  These towns are mostly the “transit villages” with easy public transportation access to New York City.

0021

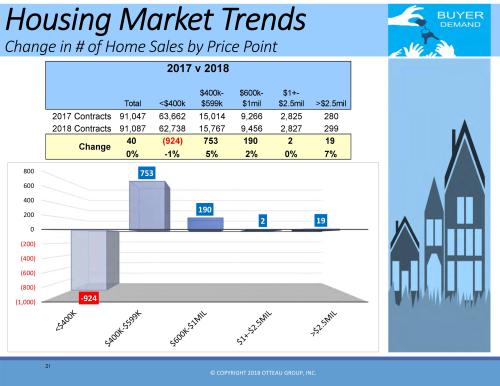
Here we see the comparison between 2017 and 2018 in number of units sold by price point.  Notice the anemic growth year over year with the lowest price point actually decreasing slightly in number of units.  The overall year to year numbers are flat.

0029

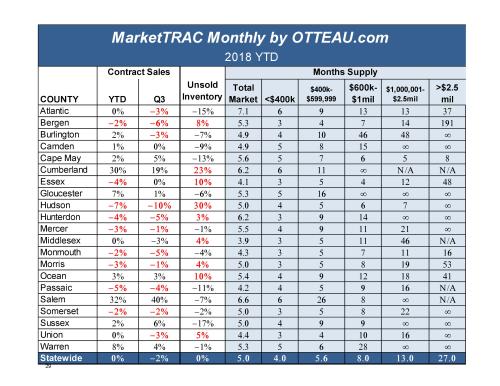
Digging a little deeper county by county shows a lot of slippage in number of contracts for housing sales.  It also shows the months supply of housing for sale per county overall and per price point.  It’s no surpise that the higher up the price point the greater the months of housing supply for sale.  The statewide numbers at the bottom of the chart show flat yearly progress vs. the past overall.

0030

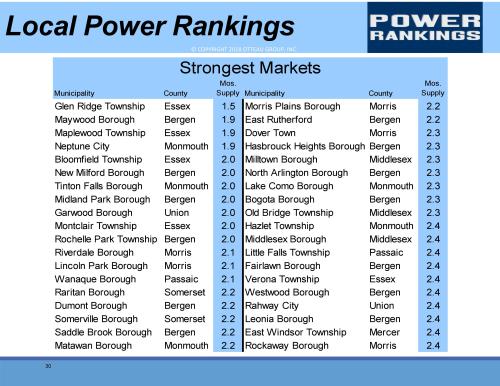
Speaking of exceptions, here are the leading markets statewide with the lowest months supply of homes for sale.  The weakest markets are towns that specialize in luxury housing or towns in the southernmost parts of the state.

0051

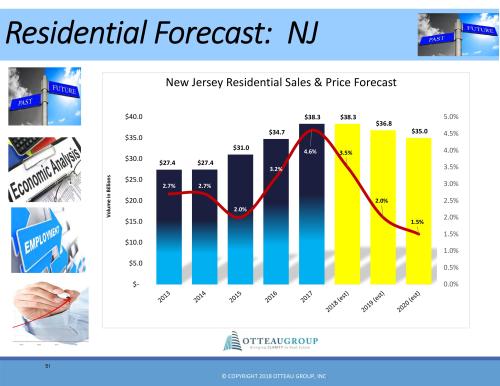
Here’s 2 indicators in one.  The bar graph shows the year over year home prices and the line graph shows them in relation to each other, rising and falling.  The striking stats are the comparisons between 2017 and the estimates for 2018.  Home prices, statewide, will rise very modestly.  Again, primary markets may perform better than the statewide averages.

Nationally, home prices have rebounded 116% of the pre-recession prices.  New Jersey state-wide prices have only recovered 92% of their pre-recession value – therefore, under-performing the national average by 24%.  One reason is the migration of business out of the state due to the cost of doing business here.

Regarding interest rates, it’s no secret they have risen in the past year.  The Federal Reserve has the unenviable task of addressing the rise in economic activity vs. the worries of investors and the volatility of the stock market in determining the rise or fall of interest rates.  Interest rates, after all, are a regulator of the economy.  The Fed can put the brakes on a burgeoning economy by raising rates in order to keep the engine cool and prevent an inflationary spiral which decreases the value of the dollar and can lead to a recession.  This rise in rates has been expected for some time and is because the economy is strong.  After all, if inflation rears its ugly head as it has in the past, rates must rise so that the dollar paid back from loans will equal the value of money originally loaned.

Obviously, mortgage interest rates are a key factor to the rise and fall of the housing market everywhere.  As noted earlier, some buyers’ incomes may not keep pace with rising interest rates coupled with rising home prices.  It’s important to remember that for every 1% rise in rates, a buyers purchasing power decreases by 9%.  I’ve highlighted this fact since it’s a bedrock principle in housing.  The chart below illustrates this relationship between rates and buying ability:

0038

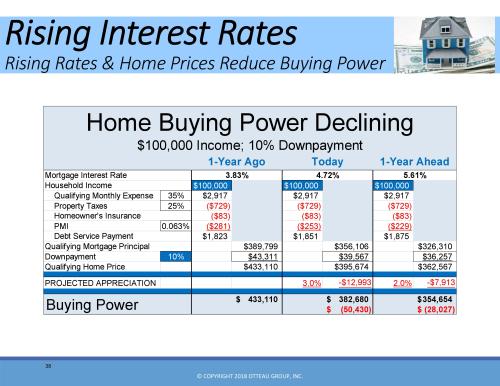
A household with a modest $100,000 annual income will only be able to afford a home price of $354,654 if rates rise to 5.61% as opposed to the $382,680 home they would buy at 4.72% or the $433,110 home they could have bought with a mortgage rate of 3.83%. The story is even more dramatic for a household with a $200,000 annual income who can only afford $973,656 as opposed to $1,223,568 as interest rate rise between the same 3.83% and 5.61%.

Accordingly, a buyer who waits now may be out of the market for the foreseeable future and a seller who waits to reduce his or her price will also lose.  Waiting is never a good strategy if the circumstances in your life point you toward buying or selling.  If your life encourages change action is better than not, regardless of market cycles.

0052

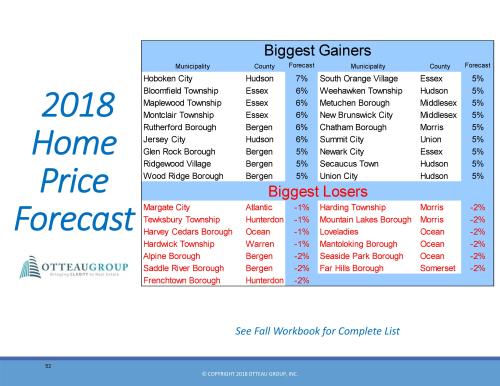
Finally, here are the biggest winners and losers among New Jersey towns with regard to future price increases as expressed in percentages per year. You will notice the “transit villages” are among those with the biggest gains vs. the “luxury heavy” towns, among the biggest losers of value.

There’s a lot to take in and, just for fun, some conflicting forces clouding the picture.  Mr. Otteau predicts the housing market still has room to grow and he’s confident we won’t go into a recessional spiral for another few years.  In the meantime, my advice is to follow your needs – don’t wait for the market to catch up with you and, certainly, don’t let the perceived market work against fulfilling your needs.
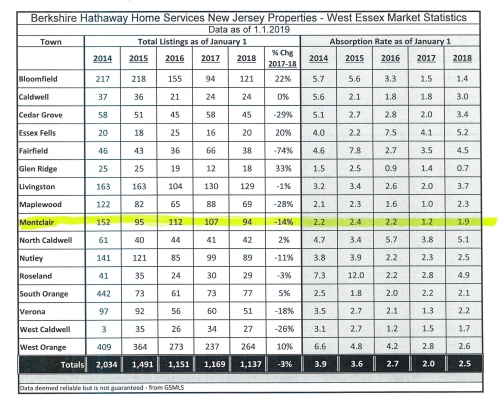
Leave a comment

Filed under Uncategorized

A Loss Deeply Felt

BHHSNJ NJ301_H_Seal_cab_cmyk

by James Stefanile, ABR, GRI, SRES, QSC, gCertified, REALTOR/Salesperson, Berkshire Hathaway Home Services New Jersey Properties, Montclair Office


The day after Thanksgiving we lost a person very close to me professionally.

Judy Zinn passed away after a long illness.  Judy brought me into the business almost 20 years ago and I felt it was a fitting tribute to re-print this post from two years ago which I dedicated to her upon her retirement.  These thoughts from then still apply:

Judy Zinn

How do you say “thank you” to someone who brought you in to the business and weaned you from a know-nothing neophyte to a REALTOR who could make a living in real estate?

How do you thank a mentor and manager who put in countless hours explaining, not only the nuts and bolts of the business, but some of its more subtler nuances as well – a testament to her vast knowledge of this profession?

judy-zinn

Judy Zinn

That was Judy Zinn who is retiring this year after more than 40 years as one of the grand dame of Essex County real estate.  Her first business was Zinn Associates REALTORS, then she joined the Prudential Real Estate network which formed in the late 1980’s as Prudential Zinn REALTORS, and then, in an act of almost clairvoyant timing, sold her business to Prudential New Jersey Properties just as the Great Recession was bursting the bubble in 2007.

After that she stayed on as an agent and friendly advisor and then Prudential Real Estate became what it is today – Berkshire Hathaway Home Services New Jersey Properties – in a brand new, state of the art office, the only one on Bloomfield Avenue in Montclair.  Our office has over forty agents currently and a leading market share as one of the top 5 brokerages, but my strongest memories are from Judy’s days as the leader of our little boutique brokerage in our funky little office on Church Street in Montclair.  She was always genial, unflappable in the face of some very strong personalities and always had the answer to any situation.  Furthermore, she always, always stressed honesty, fairness to all parties and good works. Her words still ring in my ears to this day.

Judy was a friend, as well.  Her concern for all of us transcended real estate.  She know when someone needed  a break, was stressed, needed guidance for whatever reason.  She involved herself in our families, was a great friend to my daughter and, throughout, had that rare ability to wield authority with a deft touch that was almost invisible.

In the midst of some brokerages which more resembled shark tanks she never allowed herself to be perverted by the mere pursuit of money and business.  She was an excellent business woman and successful which makes her ethic all the more remarkable.

So, I won’t try to express some unique form of gratitude. I’ll simply say thank you, Judy, for your guidance, integrity, knowledge, good humor and friendship.  Enjoy your well deserved retirement.  The business will miss you – and so will I.

We will miss you, now, more than ever. 2018

\

Leave a comment

Filed under Uncategorized

The Media as History

BHHSNJ NJ301_H_Seal_cab_cmyk


by James Stefanile, ABR, GRI, SRES, QSC, gCertified, REALTOR/Salesperson, Berkshire Hathaway Home Services New Jersey Properties, Montclair Office

It has been said that whatever you read or see or hear about real estate in the media has already happened – it’s history.

The following article in the September 29th edition of The New York Times is an example of this.

The Times reports (on its front page, in the prime position right hand column) that the housing market has slowed. Click on the following picture to read the entire article.

Jeffrey Otteau, the northern New Jersey real estate expert, had predicted months ago that rising prices, rising mortgage rates and stagnant wages were creating a disconnect between buyers and the housing market.  Also, sellers may not be selling because, in order to buy again, new mortgage money will be much more expensive than the cheaper mortgages they are currently holding.

This has contributed to the lack of inventory and the slight slump we have seen in the market lately.  As always, different areas in New Jersey experience market forces differently when it comes to housing.  Montclair, Glen Ridge and transit towns like them have not seen a noticeable sales slump and inventory is very tight.  Other localities may be experiencing more price reductions and longer days on market.  The statewide number of sales, year over year between this year and last is only up a fraction of a percent which only translates to about 600 transactions statewide. Nationally, existing home number of sales are down 1.5% year over year.  Prices are, nationally, only up 5.5% year over year which is the slowest increase in 2 years, even with consumer confidence at high levels and the unemployment rate the lowest in many years.

Housing starts (new construction), however, is up over 9% year over year which is an encouraging factor in inventory supply. The lack of housing starts during the recession recovery period was a huge contributor toward the paucity of choice for buyers.  Going forward, tariffs may dampen the growth of new housing as material prices jump and builders lose the economic incentive to start construction.

There are many conflicting trends which are competing to affect the housing market.  The large pool of buyers vs. the lack of choices to buy; the strong economy vs. the slower rate of wage increases; the strong trend of housing starts vs. the possible increase in materials cost; the recent reduction of the Consumer Price Index rate of inflation vs. the increase in mortgage rates. The increase in multiple income households vs. the rise in housing prices, Pent up demand vs. the disconnect caused by wages and rising prices, long time owners wishing a change vs. higher mortgage rates than their existing loans, the demand in cities with bustling business growth vs. high prices and low inventory and, weirdly conversely, sales slumps and price reductions vs. cities and towns in high demand.

All that being said, now, as always, the life events of the consumer are the major driving force for buying and selling, market conditions notwithstanding.  Buyers and sellers will (and should) act when they need to (or want to).  To sit on the fence while analyzing the conflicting housing trends benefits no one.

Leave a comment

Filed under Uncategorized

Tax Cuts – Price Slump?

BHHSNJ NJ301_H_Seal_cab_cmykby James Stefanile, ABR, GRI, SRES, QSC, gCertified, REALTOR/Salesperson, Berkshire Hathaway Home Services New Jersey Properties, Montclair Office

As we approach the autumn market peak later in September, it’s interesting to analyze all the factors that contribute to the state of the housing market in our local Essex County, New Jersey as a whole and nationwide.

Interest rates are ticking up, albeit slowly.  We may be near 5% in the not so distant future.  If that occurs the disconnect between buying ability and price plus interest hikes will be all the more pronounced and inventory may begin to accumulate.

Prices are not coming down.  Healthy appreciation is still occurring and 2019 is projected to be a good year for increased home equity.  Appreciation and absorption rates vary from town to town, even in popular Essex County.  The following article from the August 27th New York Times explores another wrinkle in the home price analysis.  Click on the picture to be taken to the entire article.

Leave a comment

Filed under Uncategorized

End of Spring?

BHHSNJ NJ301_H_Seal_cab_cmyk

by James Stefanile, ABR, GRI, SRES, QSC, gCertified, REALTOR/Salesperson, Berkshire Hathaway Home Services New Jersey Properties, Montclair Office

Just because it’s almost August doesn’t mean spring is over, not in the housing market, anyway.

Spring in housing was late this year for a number of reasons and the kind of housing market we associate with springtime is, to a great extent, still going on.  Many of us in the profession have sensed a shift in the market lately, perhaps a slight quieting, but, overall, as the following stats show, spring has still sprung.

The following charts show where we are and where we’ve been from 2014 to the present in suburban Essex County. Click on the chart to see a larger image:0001

Here we see January to June closings for the past 4 years and this year to date (white columns) and the average sales prices and price summaries (gray columns).

The number of closings is generally up from 2014 which is an indication of more robust home sales coming out of the recession.  Bear in mind that 2017 was the best year ever in terms of number of sales.  Closing numbers have generally kept pace with the past, slipping slightly in 2018 because of a lack of inventory.

The other half of the chart shows that prices have risen, predictably, mostly in double digits since 2014 and the emergence from the recession.  An interesting outlier is Glen Ridge where prices have actually fallen almost 8% since 2014.  Adjusting for the fact that these stats are averages, it doesn’t mean Glen Ridge is sinking.  You’ll see in a minute that what sellers are getting is robust vs. what they ask.  Also, keep in mind Glen Ridge only has a population of about 9,000.  It’s astounding it’s been the Essex County powerhouse in recent years despite its small size.

A few towns have actually have seen this year’s year-to-date prices slip below 2017, most notably Cedar Grove and Essex Fells.  In the rest of the County the difference between this year and 2017 is all over the place, with some towns’ prices falling, some rising slightly, some rising at or near the predicted 6% benchmark, some staying the same and a couple rising dramatically.  It’s difficult to perceive a trend here, given these differences.  The logical conclusion is that different towns hold different attractions plus the fact that there are different price points within certain towns and those market segments are performing differently from other price points.  The County average is up a respectable 3.4% overall and the overall average closings are up as well.

0002

Now we see the average days on market which, with a couple of exceptions, is down dramatically.  This is evidently a function of the robust market coming out of the recession.  There is generally a decrease year over year in most towns.

The List Price/Sales Price Ratio in the gray columns is the most instructive in appraising the market over the past 5 years.  The towns that don’t have triple digit ratios are the towns with the most luxury inventory and are not “train towns”.  Everywhere else in the County shows increased demand reflected in sellers getting what they ask or more.

0003(1)

The total listings reflected in gray show a general rise in listings as the market improved tempered by a lack of inventory as the market gained steam.  Overall, listings are up by 7% but some towns are showing a decrease from 2014 to the present.

The absorption rates (the amount of time it takes the market to sell what’s on the market, represented in months) are now, overall, significantly less than 2014. The real striking difference becomes clear if you remember that absorption rates before 2014 were significantly, dramatically, higher.  It’s no surprise that the market is absorbing inventory faster in a more robust market.

These figures represent what I call an “Robust Normal” market.  We have achieved normal growth while experiencing good levels of activity.  The anomalous market of 1996-2006 where growth was unnaturally high and the recessionary market of the years after the crash have evened out and returned to what has been a normal standard in long-term history.

The numbers that show the continued growth belie the concept of seasons as the market rolls on past the daffodils of spring and into the high grass of summer despite a pause here and there.  Some rising interest rates coupled with home price increases have created an affordability gap in some markets where the price of home ownership rises faster than buyers’ ability to afford the increases.  This would account for some of the sluggishness during some periods of this year in some townships, but not all.

Leave a comment

Filed under Uncategorized

A Late Spring

BHHSNJ NJ301_H_Seal_cab_cmyk

by James Stefanile, ABR, GRI, SRES, QSC, gCertified, REALTOR/Salesperson, Berkshire Hathaway Home Services New Jersey Properties, Montclair Office

I am frequently asked why there seems to be more houses for sale recently.  People are surprised by the blossom of lawn signs when there’s supposed to be nothing for sale.

Improbable as it may seem, both situations are true: there is more for sale now and inventory continues to be tight.

“More” is a relative term.  Right now there’s more than the “less” that existed earlier in the spring.  As summer starts in this month of June we are actually time traveling back to March/April in real estate time and there’s probably more than one reason, but, mainly, it’s Tax Reform.

The confusion and apprehension surrounding the roll-out of the tax reform legislation at the beginning of the year created a pause in the housing market.  Real estate, like any other market, hates uncertainty.  Compounding that uncertainty was the secrecy used to draft the legislation and the opposition’s apocalyptic predictions based on no facts.

Jeffry Otteau, New Jersey’s premiere prognosticator of property trends predicted at the beginning of 2018 that the hubbub surrounding tax reform would delay the spring real estate market.  He said that the facts would start to trickle out in a few months and people’s anxiety would begin to abate.  When that occurs, he predicted, the spring market would flourish as always.  That is exactly what seems to be occurring in late May and June.  We are where we should have been, inventory wise, in March.  The spring market has become the summer solstice market.

This season’s market was envisioned as the most robust ever.  We were supposed to be out of inventory to sell by now.  The demand has not been slaked,  just suspended and, now, it’s re-appeared, rising temperatures notwithstanding.  Prices are still rising, listings are still coming on, multiple offers are still appearing, towns not usually hot are heating up as the temperature radiates out from the most popular towns.

I’ve had active summers before.  In Augusts past, when I’m supposed to be sitting under a tree for lack of something to do, I have been knee-deep in transactions.  There’s no guarantee that because it’s summer the market will fizzle.  It’s not a given that a late spring market will cool in summer’s heat.  July is traditionally a big closing month for transactions beginning in April and May.  This year that will probably translate to August and September.  The momentum we’ve been used to is back, a late guest to the property party.

Leave a comment

Filed under Uncategorized

Fair Housing’s Anniversary and Peril

BHHSNJ NJ301_H_Seal_cab_cmyk

by James Stefanile, ABR, GRI, SRES, QSC, gCertified, REALTOR/Salesperson, Berkshire Hathaway Home Services New Jersey Properties, Montclair Office


This article on the OpEd page of The New York Times, Monday, May 14th is worth repeating. Click the illustration or headline to read it:


HUD doesn’t get many headlines.  Even this story was buried in the back pages.  It’s the 50th anniversary of the Fair Housing Act of 1968 but it’s seems it’s more under siege than celebrating a milestone.

This historic legislation, hard won and emanating from the cauldron of the Civil Rights Movement in the 60’s, is, in my view, inviolable.  It was drafted to correct an inequity and to restore the civil rights of a segment of Americans suffering from long standing housing and lending practices.  Critics have called it “social engineering”.  I believe it’s simply an attempt to put in to practice an ideal this country was, supposedly, founded upon.

FairHousingCommemoration_thumbnail


Leave a comment

Filed under Uncategorized